
2015
Type of resources
Available actions
Topics
Keywords
Contact for the resource
Provided by
Years
Formats
Representation types
Update frequencies
status
Resolution
-
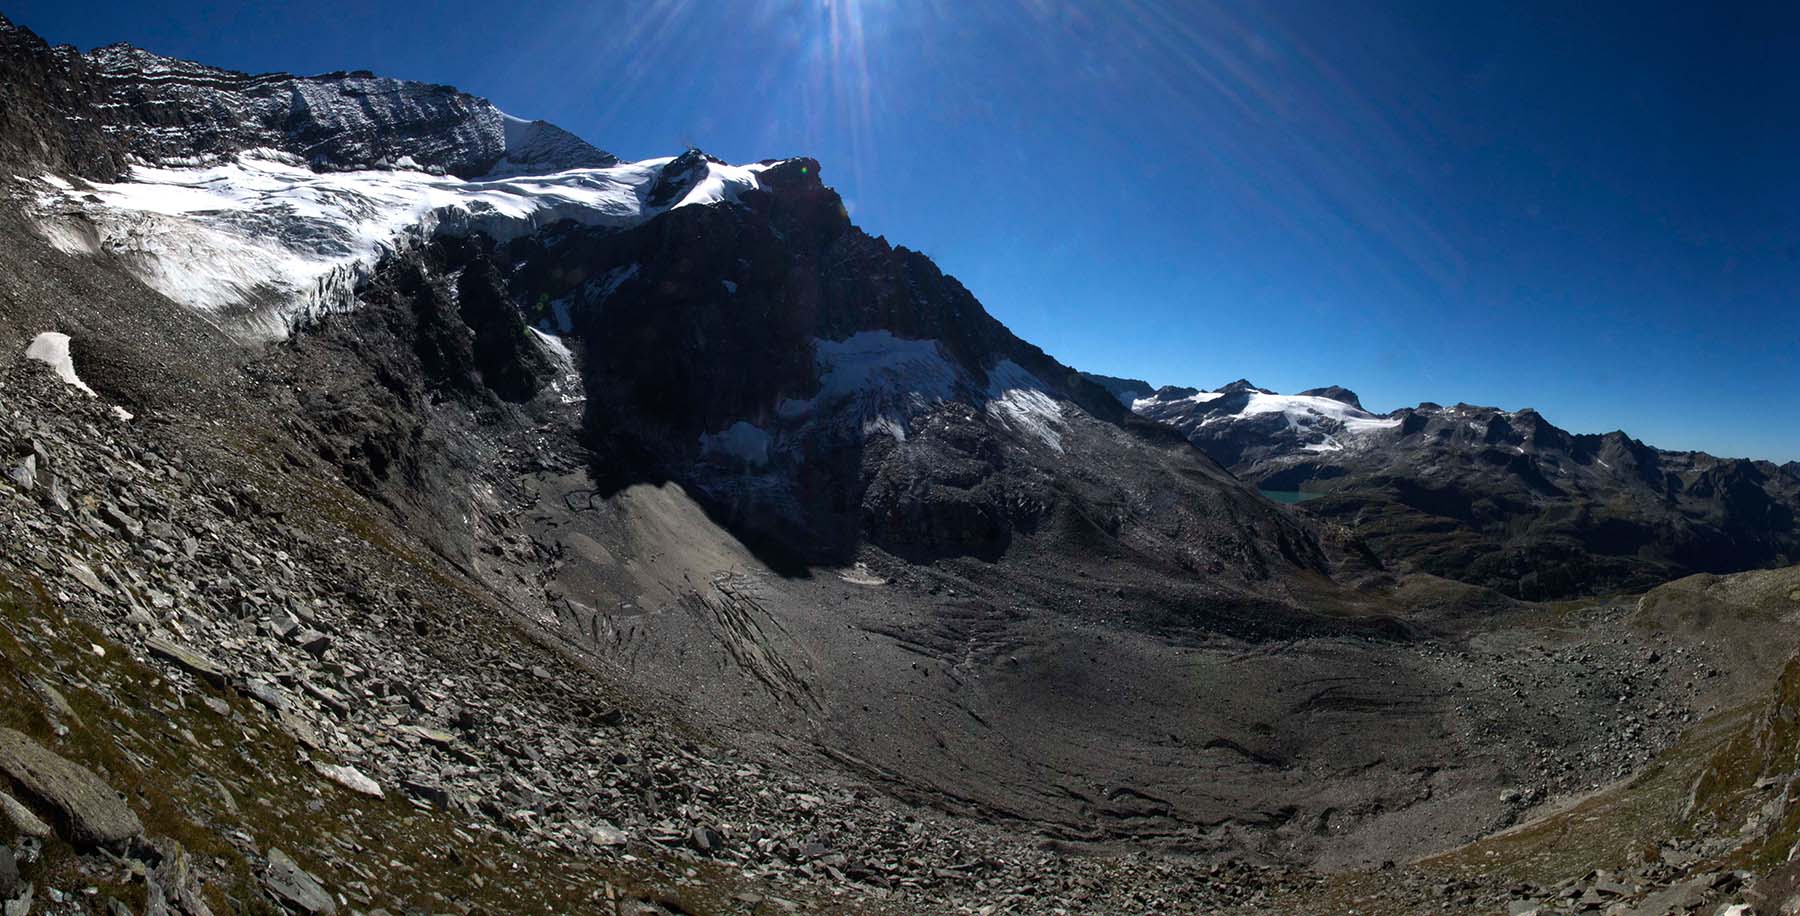
Reconstituted glacier by ice avalanches from Oberes Riffelkees(Totenlöcher). The Untere Riffelkees is a heavyly debris covered glacier tongue(Bergsturz around 1906). The glaicer is situated in the western Glocknergruppe in the upper Stubach Valley.
-
Dataset contains subnival soil temperatures (°C) measured in 10 cm soil depth in three different subnival plots in Obergurgl, Austria. Data Logger: TidBit v2TempLogger onsetcomp.com Soil temperature was calculated in Mean temperature, mean daily Maximum and mean daily Minimum temperatures. Subnival locations: 1. Liebener Rippe, 2830 m a.s.l., pioneer stage, sparse vegetation 2. Liebener Rippe, 2790 m a.s.l., Elynetum, alpine grassland 3. Glacier foreland, moraine 2009, 2490 m a.s.l., sparse vegetation
-
na
-
The meteorological station is operated by the Regional Agency for the Protection of the Environment (Agenzia Regionale per la Protezione Ambientale - ARPA) of Piedmont. The agency is a public body with independent status for administrative, technical-juridical, asset management and accounting purposes. The dataet provides data on daily precipitation (in mm), daily average temperature (in °C), total radiation (MJ/mq).
-
Data shows time periods when the lake was covered with ice
-
Cembran pine forests and dwarf shrub heaths are characteristic plant communities in the subalpine zone of the inner Oetz valley. The dwarf shrub heaths can be differentiated by canopy height and microrelief. To document the dwarf shrub heaths, 21 vegetation records were made from 25.08.2010 to 26.08.2010 Dwarf shrub heaths were attributed to the Rhododendretum ferruginei in troughs and the Loiseleurio-Cetrarietum on wind-exposed edges. Vegetation records were made in plots according to minimum areal of Braun-Blanquet (1964)
-
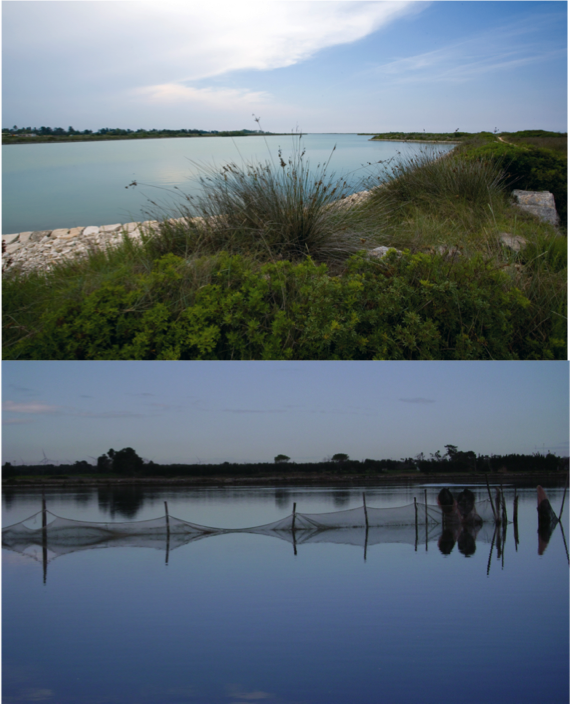
The Salento lagoons site comprises two coastal brackish lagoons located in the South Apulia (SE Italy): Acquatina and Alimini. Acquatina is a semi-artificial and meso-oligotrophic basin with a surface area of 0.45 km2 and an average depth of 1.2 m. Since 1985 the basin has been managed by University of Salento and is the focus of several scientific studies. Alimini is a mesotrophic, relatively small (surface area=1.375 km2) and shallow (average depth=1.5 m) lagoon. In Acquatina, the seagrass Cymodocea nodosa covers more than 50% of the lagoon bottoms, while other seagrasses of the genus Ruppia and Zostera together with macroalgae of the genera Ulva, Ceranium, Chondria and Caulerpa are locally abundant. In Alimini lagoon, primary producers are restricted to phytoplankton (Thalassiosira sp.; Chaetoceros sp. ) and submerged macrophytes (Phragmites australis). Dominant benthic species are Heteromastus filiformis, Cirrophorus furcatus, Cerithium vulgatum and Loripes lacteus in Acquatina, while Loripes lacteus, Heteromastus filiformis and Owenia fusiformis in Alimini. Mullets, eels, sea-bass and sea-bream are the main fish species present in both ecosystems. Acquatina and Alimini lagoons are relatively pristine ecosystems. A small human impact is mainly related to the discharge of nutrients into the lagoons due to inland agricultural activities and fishing activities. Both ecosystems are included in Natura 2000 sites according to the Habitats Directive.
-
Dataset provides information about soil temperature, soil C and N dynamics at different sites in the alpine tundra, along an elevational gradient from 2500 to 2900 m asl during the period 2005-2018. Moreover, in ordrer to evaluate how topsoil can influence the quality of surface water, lake water was sampled monthly at the same time that soil was sampled. The N-NO3 concentration is measured in water samples collected in triplicate in two lakes (Cimalegna and Bowditch). The ongoing studies aimed at investigating how the meteorological variables affect the biogeochemistry of seasonally snow covered areas, with a special focus on the effect of the snow cover duration on soil and water C and N dynamics during the growing season.
-
Vegetation and environmental data were collected during the summers 1996-1999 along two lateral-transects and two longitudinal-transects of the Rotmoos valley glacierforeland Successional pattern of the vegetation on the area exposed by glacial retreat was recorded by studying discontinuous plots. All plots have a size of 1 m²; vegetational records were made using a metal frame of 1m² The lateral-transects were located across morainic ridges formed by intermittent glacial retreats in 1858 and 1923. Vegetation records were made in 1996 and 1997 The longitudinal-transects ranched from the glacier-tounge (1996) to the terminal moraine from 1858. Vegetation records were made in 1998 and1999. Additionally soil samplings were taken and pH-values were determined in each plot. Also soil moisture factors were estimated along the lateral-transect.
-
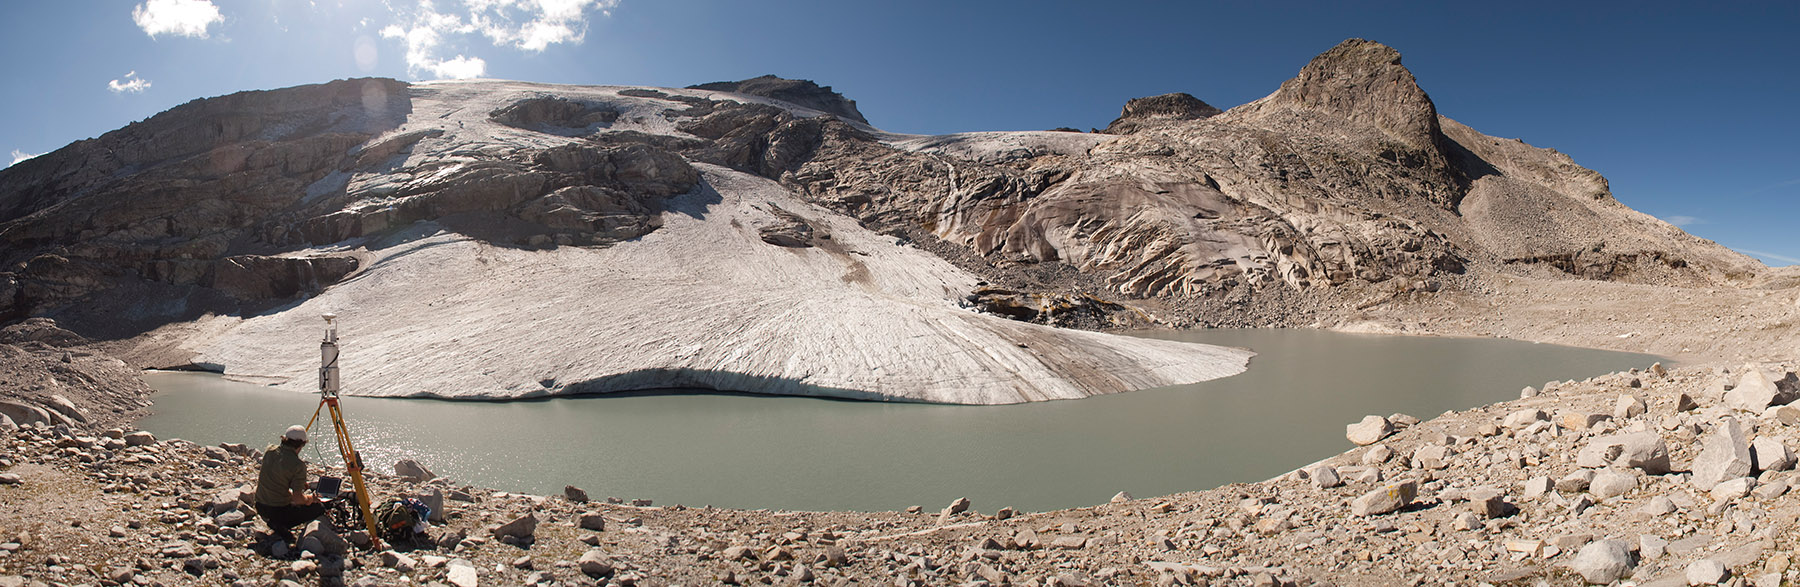
The formation of a periglacial lake was forced at the glacier terminus in recent years by the fast disintegration of the glacier. The development of the untere Eisboden See is well documented. Since August 2002, a runoff gauge installed by the Hydrographical Service of Salzburg has recorded the discharge at the outlet of the new Unterer Eisboden See.